tracking_difference_annualized
- AssetList.tracking_difference_annualized(rolling_window=None)
Calculate annualized tracking difference time series for the rate of return of assets.
Tracking difference is calculated by measuring the accumulated difference between the returns of a benchmark and ETFs replicating it (could be mutual funds, or other types of assets). Tracking difference is measured in percents.
Benchmark should be in the first position of the symbols list in AssetList parameters.
Annual values are available for history periods of more than 12 months. Returns for less than 12 months can’t be annualized According to the CFA Institute’s Global Investment Performance Standards (GIPS).
- Parameters:
- rolling_windowint or None, default None
Size of the moving window in months. Must be at least 12 months. If None calculate expanding annualized tracking difference.
- Returns:
- DataFrame
Annualized tracking diffirence time series for each asset.
Examples
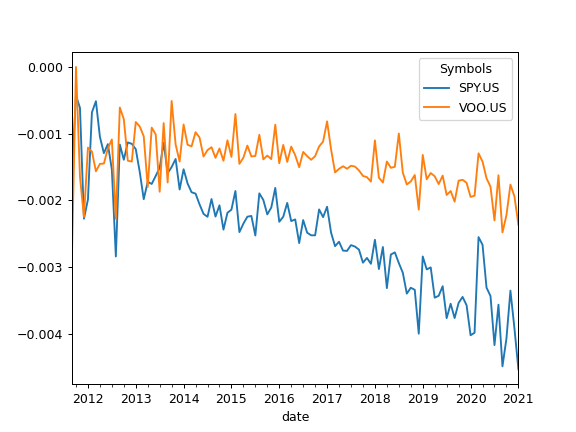
>>> import matplotlib.pyplot as plt
>>> x = ok.AssetList(["SP500TR.INDX", "SPY.US", "VOO.US"], last_date="2021-01")
>>> x.tracking_difference_annualized().plot()
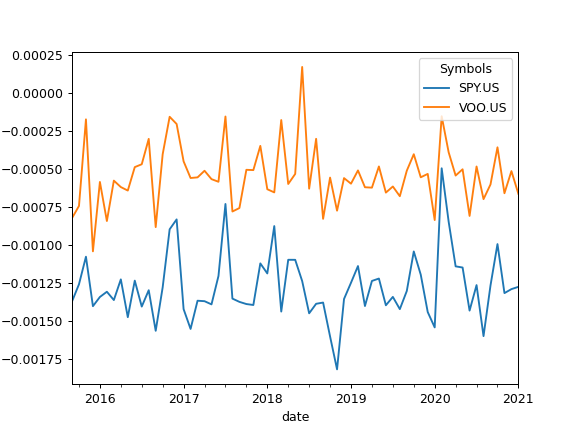
To calculate rolling annualized tracking difference set rolling_window to a number of months (moving window size):
>>> x.tracking_difference_annualized(rolling_window=12 * 5).plot()
>>> plt.show()