dividend_yield_annual
- property AssetList.dividend_yield_annual
Calculate last twelve months (LTM) dividend yield annual time series.
Time series is based on the dividend yield for the end of calendar year.
LTM dividend yield is the sum trailing twelve months of common dividends per share divided by the current price per share.
All yields are calculated in the asset list base currency after adjusting the dividends and price time series. Forecasted (future) dividends are removed.
- Returns:
- DataFrame
Time series of LTM dividend yield for each asset.
See also
dividend_yieldDividend yield time series.
dividends_annualCalendar year dividends time series.
dividend_paying_yearsNumber of years of consecutive dividend payments.
dividend_growing_yearsNumber of years when the annual dividend was growing.
get_dividend_mean_yieldArithmetic mean for annual dividend yield.
get_dividend_mean_growth_rateGeometric mean of annual dividends growth rate.
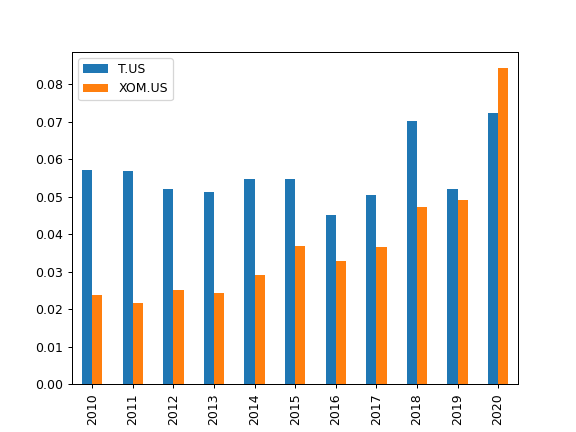
Examples
>>> import matplotlib.pyplot as plt
>>> x = ok.AssetList(["T.US", "XOM.US"], first_date="2010-01", last_date="2020-12")
>>> x.dividend_yield_annual.plot(kind="bar")
>>> plt.show()