okama.AssetList.plot_assets
- AssetList.plot_assets(kind='mean', tickers='tickers', pct_values=False, xy_text=(0, 10))
Plot the assets points on the risk-return chart with annotations.
Annualized values for risk and return are used. Risk is a standard deviation of monthly rate of return time series. Return can be an annualized mean return (expected return) or CAGR (Compound annual growth rate).
- Parameters:
- kind{‘mean’, ‘cagr’}, default ‘mean’
Type of Return: annualized mean return (expected return) or CAGR (Compound annual growth rate).
- tickers{‘tickers’, ‘names’} or list of str, default ‘tickers’
Annotation type for assets. ‘tickers’ - assets symbols are shown in form of ‘SPY.US’ ‘names’ - assets names are used like - ‘SPDR S&P 500 ETF Trust’ To show custom annotations for each asset pass the list of names.
- pct_valuesbool, default False
Risk and return values in the axes: Algebraic annotation (False) Percents (True)
- xy_texttuple, default (0, 10)
The shift of the annotation text (x, y) from the point.
- Returns:
- Axes‘matplotlib.axes._subplots.AxesSubplot’
Examples
>>> import matplotlib.pyplot as plt
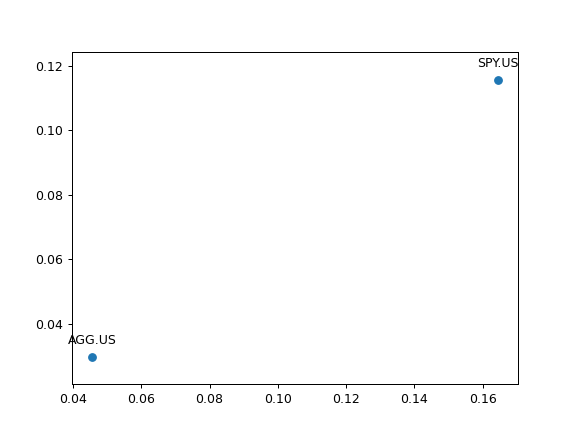
>>> al = ok.AssetList(['SPY.US', 'AGG.US'], ccy='USD', inflation=False)
>>> al.plot_assets()
>>> plt.show()

Plotting with default parameters values shows expected return, ticker annotations and algebraic values for risk and return. To use CAGR instead of expected return use kind=’cagr’.
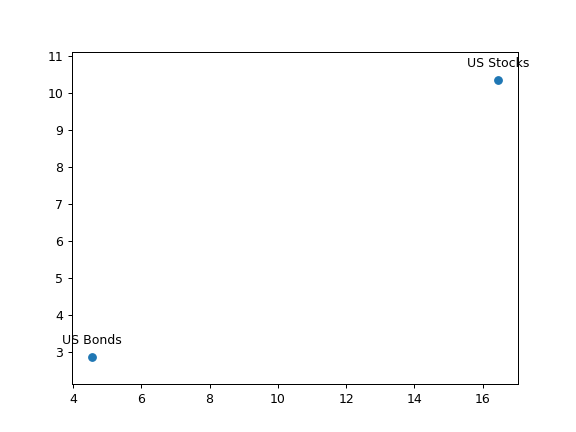
>>> al.plot_assets(kind='cagr',
...               tickers=['US Stocks', 'US Bonds'],  # use custom annotations for the assets
...               pct_values=True  # risk and return values are in percents
...               )
>>> plt.show()
