Inflation
- class Inflation(symbol='RUB.INFL', first_date=None, last_date=None)
Bases:
MacroABCInflation related data and methods.
Inflation symbols are in ‘.INFL’ namespace.
- Parameters:
- symbol: str
Inflation symbol is unique series of letters with namespace after dot (EUR.INFL).
- first_datestr, default None
First date of the values time series (2020-01).
- last_datestr, default None
Last date of the values time series (2022-03).
Methods & Attributes
Calculate annual inflation time series.
Calculate cumulative inflation rate time series for the whole period.
describe([years])Generate descriptive inflation statistics for YTD and a given list of periods.
Purchasing power of 1000 (in the currency of inflation) after period from first_date to last_date.
Calculate 12 months rolling inflation time series.
set_values_monthly(date, value)Set monthly value for the past or future date.
Return values time series historical monthly data.
- property cumulative_inflation
Calculate cumulative inflation rate time series for the whole period.
- Returns:
- Series
Cumulative inflation rate.
Examples
>>> x = ok.Inflation("RUB.INFL", first_date="2020-01", last_date="2020-12")
>>> x.cumulative_inflation
date
2020-01    0.004000
2020-02    0.007313
2020-03    0.012853
2020-04    0.021260
2020-05    0.024018
2020-06    0.026270
2020-07    0.029862
2020-08    0.029450
2020-09    0.028730
2020-10    0.033153
2020-11    0.040489
2020-12    0.049125
Freq: M, Name: RUB.INFL, dtype: float64
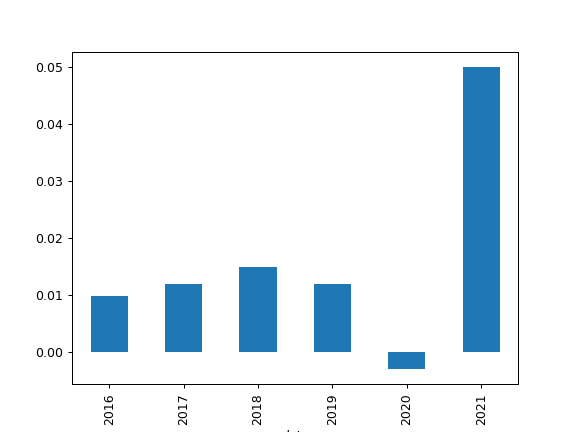
- property annual_inflation_ts
Calculate annual inflation time series.
Inflation is calculated for each calendar year.
- Returns:
- Series
Calendar annual Inflation time series.
Examples
>>> import matplotlib.pyplot as plt
>>> infl = ok.Inflation("EUR.INFL", first_date="2016-01", last_date="2021-12")
>>> infl.annual_inflation_ts.plot(kind="bar")
>>> plt.show()
- property purchasing_power_1000
Purchasing power of 1000 (in the currency of inflation) after period from first_date to last_date.
- Returns:
- float
The Purchasing power of 1000 currency units.
Examples
>>> x = ok.Inflation("RUB.INFL", first_date="2000-01", last_date="2020-12")
>>> x.purchasing_power_1000
145.8118461948026
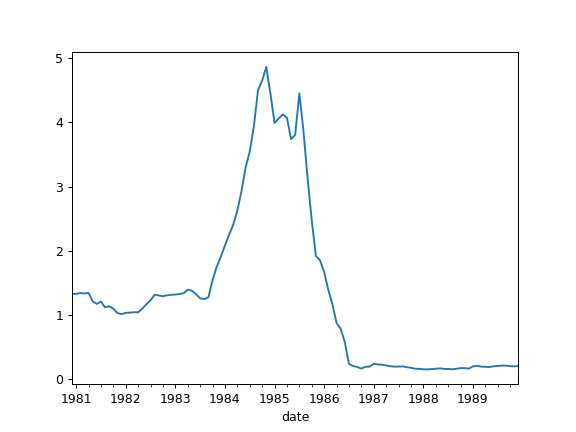
- property rolling_inflation
Calculate 12 months rolling inflation time series.
- Returns:
- Series
12 months rolling inflation time series.
Examples
>>> import matplotlib.pyplot as plt
>>> infl = ok.Inflation("ILS.INFL", first_date="1980-01", last_date="1989-12")
>>> infl.rolling_inflation.plot()
>>> plt.show()
- describe(years=(1, 5, 10))
Generate descriptive inflation statistics for YTD and a given list of periods.
Statistics includes:
YTD compound inflation
Annual inflation (geometric mean) for a given list of periods
max 12 months inflation for the periods
Annual inflation (geometric mean) for the whole history
- Parameters:
- yearstuple of (int,), default (1, 5, 10)
List of periods in years for the Inflation.
- Returns:
- DataFrame
Table of descriptive statistics for Inflation.
Examples
>>> infl = ok.Inflation("USD.INFL", last_date="2022-04")
>>> infl.describe(years=(1, 15, 50))
         property               period    USD.INFL
0      compound inflation                  YTD    0.036987
1   1000 purchasing power                  YTD  964.332475
2        annual inflation              1 years    0.082611
3      compound inflation              1 years    0.082611
4       max 12m inflation              2022-03    0.085410
5   1000 purchasing power              1 years  923.692547
6        annual inflation             15 years    0.022632
7      compound inflation             15 years    0.398916
8       max 12m inflation              2022-03    0.085410
9   1000 purchasing power             15 years  714.839226
10       annual inflation             50 years    0.039595
11     compound inflation             50 years    5.969612
12      max 12m inflation              1980-03    0.147383
13  1000 purchasing power             50 years  143.480004
14       annual inflation  109 years, 3 months    0.031470
15     compound inflation  109 years, 3 months   28.519646
16      max 12m inflation              1920-06    0.236888
17  1000 purchasing power  109 years, 3 months   33.875745
- set_values_monthly(date, value)
Set monthly value for the past or future date.
The date should be in month period format (“2023-12”). T The result stored only in the class instance. It can be used to analyze inflation with forecast or corrected data.
Examples
>>> infl = ok.Inflation("USD.INFL", last_date="2022-04")
>>> infl.values_monthly.tail()  # last 5 months statistics
date
2021-12    0.0031
2022-01    0.0084
2022-02    0.0091
2022-03    0.0134
2022-04    0.0056
Freq: M, Name: USD.INFL, dtype: float64
>>> infl.set_values_monthly(date="2024-05", value=0.09)  # set forecasted inflation value
>>> infl.values_monthly.tail()  # check the statistics again (May data is available now)
date
2022-01    0.0084
2022-02    0.0091
2022-03    0.0134
2022-04    0.0056
2024-05    0.0900
Freq: M, Name: USD.INFL, dtype: float64
- property values_monthly
Return values time series historical monthly data.
- Returns:
- Series
Time series of values historical data (monthly).