annual_return_ts
- property AssetList.annual_return_ts
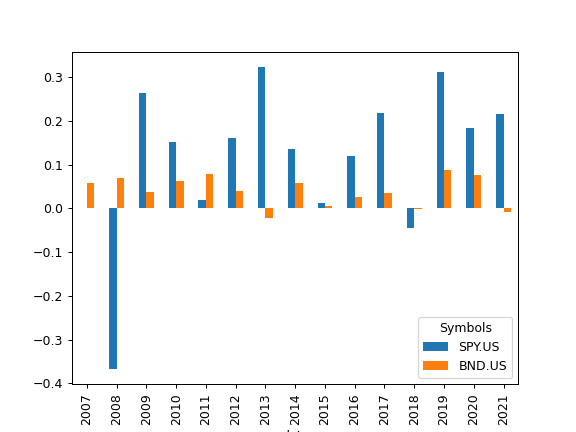
Calculate annual rate of return time series for each asset.
Rate of return is calculated for each calendar year.
- Returns:
- DataFrame
Calendar annual rate of return time series.
Examples
>>> import matplotlib.pyplot as plt
>>> al = ok.AssetList(["SPY.US", "BND.US"], last_date="2021-08")
>>> al.annual_return_ts.plot(kind="bar")
>>> plt.show()