index_beta
- AssetList.index_beta(rolling_window=None)
Compute beta coefficient time series for the assets.
Beta coefficient is defined in Capital Asset Pricing Model (CAPM). It is a measure of how an individual asset moves (on average) when the benchmark increases or decreases. When beta is positive, the asset price tends to move in the same direction as the benchmark, and the magnitude of beta tells by how much.
Index (benchmark) should be in the first position of the symbols list in AssetList parameters. There should be at least 12 months of historical data.
- Parameters:
- rolling_windowint or None, default None
Size of the moving window in months. Must be at least 12 months. If None calculate expanding beta coefficient.
- Returns:
- DataFrame
rollinf or expanding beta coefficient time series for each asset.
See also
index_corrCompute correlation with the index (or benchmark).
index_rolling_corrCompute rolling correlation with the index (or benchmark).
index_betaCompute beta coefficient.
Examples
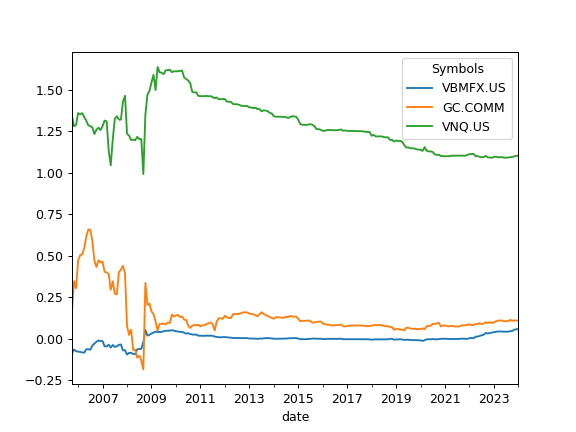
>>> import matplotlib.pyplot as plt
>>> sp = ok.AssetList(["SP500TR.INDX", "VBMFX.US", "GC.COMM", "VNQ.US"])
>>> sp.names
{'SP500TR.INDX': 'S&P 500 (TR)',
'VBMFX.US': 'VANGUARD TOTAL BOND MARKET INDEX FUND INVESTOR SHARES',
'GC.COMM': 'Gold',
'VNQ.US': 'Vanguard Real Estate Index Fund ETF Shares'}
>>> sp.index_beta().plot()
>>> plt.show()
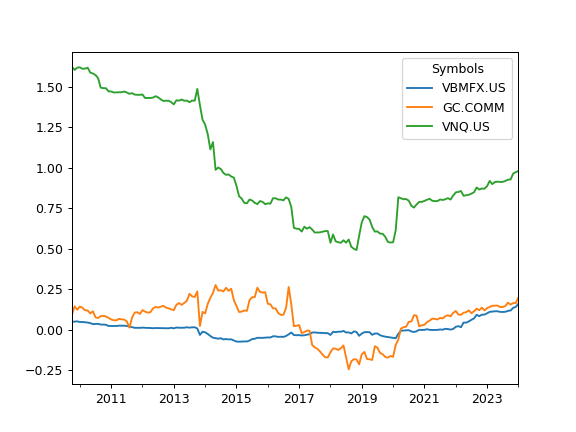
To calculate rolling beta set rolling_window to a number of months (moving window size):
>>> sp.index_beta(rolling_window=12 * 5).plot()  # 5 years moving window
>>> plt.show()