Asset
- class Asset(symbol='SPY.US', first_date=None, last_date=None)
Bases:
objectA financial asset, that could be used in a list of assets or in portfolio.
- Parameters:
- symbol: str, default ‘SPY.US’
Symbol is an asset ticker with a namespace after dot. The default value is ‘SPY.US’ (SPDR S&P 500 ETF Trust).
- first_datestr, pd.Timestamp, None, default None
First date of the rate of return time series. If None, the first available date will be used.
- last_datestr, pd.Timestamp, None, default None
Last date of the rate of return time series. If None, the last available date will be used.
Methods & Attributes
Return adjusted close price time series historical daily data.
Return close price time series historical daily data.
Return close price time series historical monthly data.
Return dividends time series historical monthly data.
Return NAV time series (monthly) for mutual funds.
Return live price of an asset.
Return a symbol of the asset.
- property symbol
Return a symbol of the asset.
- Returns:
- str
- property price
Return live price of an asset.
Live price is delayed (15-20 minutes). For certain namespaces (FX, INDX, PIF etc.) live price is not supported.
- Returns:
- float, None
Live price of the asset. Returns None if not defined.
- property close_daily
Return close price time series historical daily data.
- Returns:
- Series
Time series of close price historical data (daily).
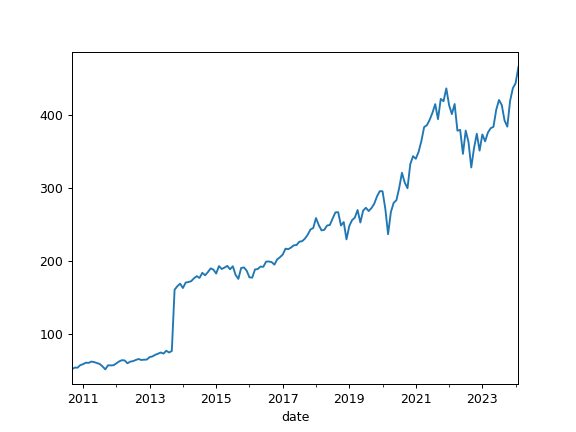
- property close_monthly
Return close price time series historical monthly data.
Monthly close time series not adjusted to for corporate actions: dividends and splits.
- Returns:
- Series
Time series of close price historical data (monthly).
Examples
>>> import matplotlib.pyplot as plt
>>> x = ok.Asset("VOO.US")
>>> x.close_monthly.plot()
>>> plt.show()
- property adj_close
Return adjusted close price time series historical daily data.
The adjusted closing price amends a stock’s closing price after accounting for corporate actions: dividends and splits. All values are adjusted by reducing the price prior to the dividend payment (or split).
- Returns:
- Series
Time series of adjusted close price historical data (daily).
- property dividends
Return dividends time series historical monthly data.
- Returns:
- Series
Time series of dividends historical data (monthly).
Examples
>>> x = ok.Asset("VNQ.US")
>>> x.dividends
        Date
2004-12-22    1.2700
2005-03-24    0.6140
2005-06-27    0.6440
2005-09-26    0.6760
               ...
2020-06-25    0.7590
2020-09-25    0.5900
2020-12-24    1.3380
2021-03-25    0.5264
Freq: D, Name: VNQ.US, Length: 66, dtype: float64
Return NAV time series (monthly) for mutual funds.