index_corr
- AssetList.index_corr(rolling_window=None)
Compute correlation with the index (or benchmark) time series for the assets. Expanding or rolling correlation is available.
Index (benchmark) should be in the first position of the symbols list in AssetList parameters. There should be at least 12 months of historical data.
- Parameters:
- rolling_windowint or None, default None
Size of the moving window in months. Must be at least 12 months. If None calculate expanding correlation with index.
- Returns:
- DataFrame
Rolling or expanding correlation with the index (or benchmark) time series for each asset.
Examples
>>> import matplotlib.pyplot as plt
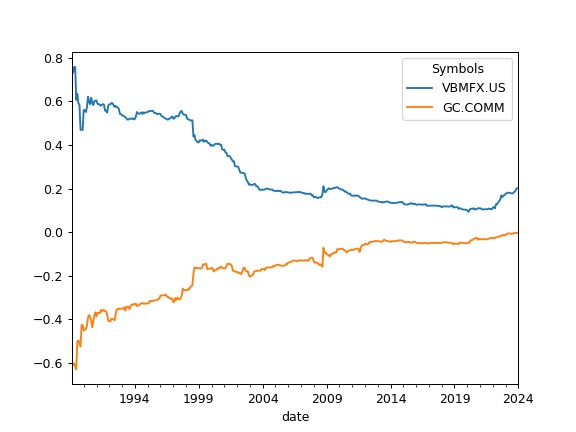
>>> sp = ok.AssetList(["SP500TR.INDX", "VBMFX.US", "GC.COMM"])
>>> sp.names
{'SP500TR.INDX': 'S&P 500 (TR)',
'VBMFX.US': 'VANGUARD TOTAL BOND MARKET INDEX FUND INVESTOR SHARES',
'GC.COMM': 'Gold'}
>>> sp.index_corr().plot()  # expanding correlation with S&P 500
>>> plt.show()
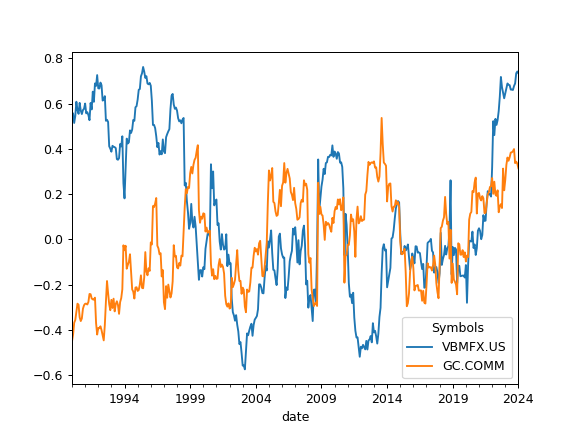
To calculate rolling correlation with S&P 500 set rolling_window to a number of months (moving window size):
>>> sp.index_corr(rolling_window=24).plot()
>>> plt.show()