okama.Portfolio.skewness
- property Portfolio.skewness
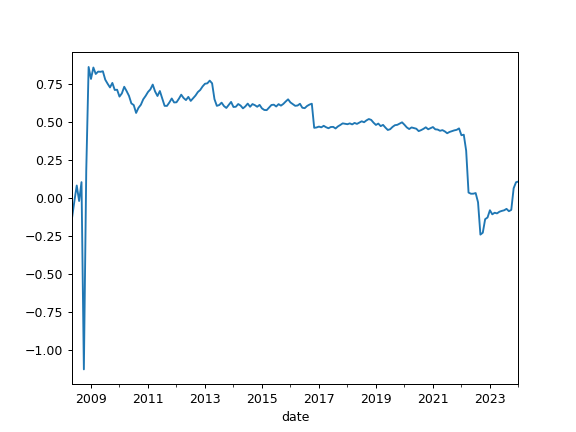
Compute expanding skewness time series for portfolio rate of return.
For normally distributed data, the skewness should be about zero. A skewness value greater than zero means that there is more weight in the right tail of the distribution.
- Returns:
- Series
Expanding skewness time series
Examples
>>> pf = ok.Portfolio(['BND.US'])
>>> pf.skewness
Date
2008-05   -0.134193
2008-06   -0.022349
2008-07    0.081412
2008-08   -0.020978
             ...
2021-04    0.441430
2021-05    0.445772
2021-06    0.437383
2021-07    0.425247
Freq: M, Name: portfolio_8378.PF, Length: 159, dtype: float64
>>> import matplotlib.pyplot as plt
>>> pf.skewness.plot()
>>> plt.show()