dividend_yield
- property Portfolio.dividend_yield
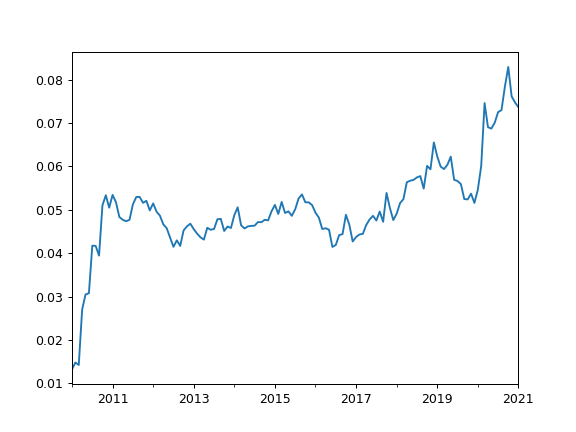
Calculate last twelve months (LTM) dividend yield time series for the portfolio. Time series has monthly values.
Portfolio dividend yield is a weighted sum of the assets dividend yields (adjusted to the portfolio base currency).
For an asset LTM dividend yield is the sum trailing twelve months of common dividends per share divided by the current price per share.
- Returns:
- Series
Portfolio LTM dividend yield monthly time series.
Examples
>>> pf = ok.Portfolio(["T.US", "XOM.US"], weights=[0.8, 0.2], first_date="2010-01", last_date="2021-01", ccy="USD")
>>> pf.dividend_yield
2010-01    0.013249
2010-02    0.014835
2010-03    0.014257
             ...
2020-11    0.076132
2020-12    0.074743
2021-01    0.073643
Freq: M, Name: portfolio_8836.PF, Length: 133, dtype: float64
>>> import matplotlib.pyplot as plt
>>> pf.dividend_yield.plot()
>>> plt.show()