okama.Portfolio.plot_hist_fit
- Portfolio.plot_hist_fit(distr='norm', bins=None)
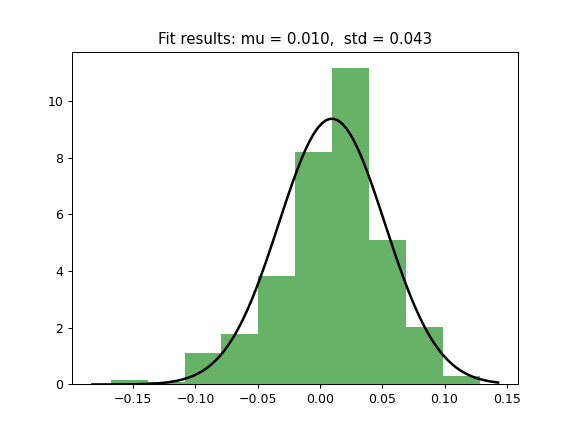
Plot historical distribution histogram for ptrtfolio monthly rate of return time series and theoretical PDF (Probability Distribution Function).
Examples
>>> import matplotlib.pyplot as plt
>>> pf = ok.Portfolio(['SP500TR.INDX'])
>>> pf.plot_hist_fit(distr='norm')
>>> plt.show()