okama.Portfolio.plot_percentiles_fit
- Portfolio.plot_percentiles_fit(distr='norm', figsize=None)
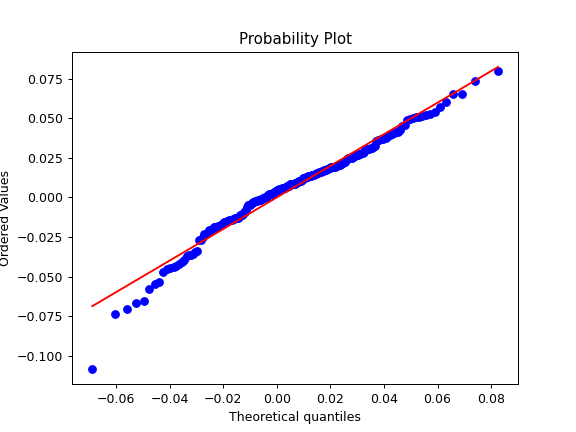
Generate a quantile-quantile (Q-Q) plot of portfolio monthly rate of return against quantiles of a given theoretical distribution.
A q-q plot is a plot of the quantiles of the portfolio rate of return historical data against the quantiles of a given theoretical distribution.
- Parameters:
- distr{‘norm’, ‘lognorm’}, default ‘norm’
The name of a distribution to fit. ‘norm’ - for normal distribution. ‘lognorm’ - for lognormal distribution.
- figsize(float, float), optional
Width and height of plot in inches. If None default matplotlib figsize value is used.
Examples
>>> import matplotlib.pyplot as plt
>>> pf = ok.Portfolio(['SPY.US', 'AGG.US', 'GLD.US'], weights=[.60, .35, .05], rebalancing_period='year')
>>> pf.plot_percentiles_fit(distr='lognorm')
>>> plt.show()