okama.Portfolio.kurtosis
- property Portfolio.kurtosis
Calculate expanding Fisher (normalized) kurtosis time series for portfolio rate of return.
Kurtosis is a measure of whether the rate of return are heavy-tailed or light-tailed relative to a normal distribution. It should be close to zero for normally distributed rate of return. Kurtosis is the fourth central moment divided by the square of the variance.
- Returns:
- Series
Expanding kurtosis time series
Examples
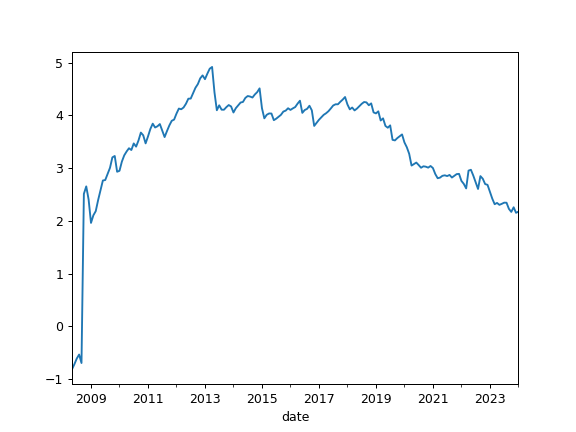
>>> pf = ok.Portfolio(['BND.US'])
>>> pf.kurtosis
Date
2008-05   -0.815206
2008-06   -0.718330
2008-07   -0.610741
2008-08   -0.534105
             ...
2021-04    2.821322
2021-05    2.855267
2021-06    2.864717
2021-07    2.850407
Freq: M, Name: portfolio_4411.PF, Length: 159, dtype: float64
>>> import matplotlib.pyplot as plt
>>> pf.kurtosis.plot()
>>> plt.show()