okama.Portfolio.kurtosis_rolling
- Portfolio.kurtosis_rolling(window=60)
Calculate rolling Fisher (normalized) kurtosis time series for portfolio rate of return.
Kurtosis is a measure of whether the rate of return are heavy-tailed or light-tailed relative to a normal distribution. It should be close to zero for normally distributed rate of return. Kurtosis is the fourth central moment divided by the square of the variance.
- Parameters:
- windowint, default 60
Size of the moving window in months. The window size should be at least 12 months.
- Returns:
- Series
Expanding kurtosis time series.
Examples
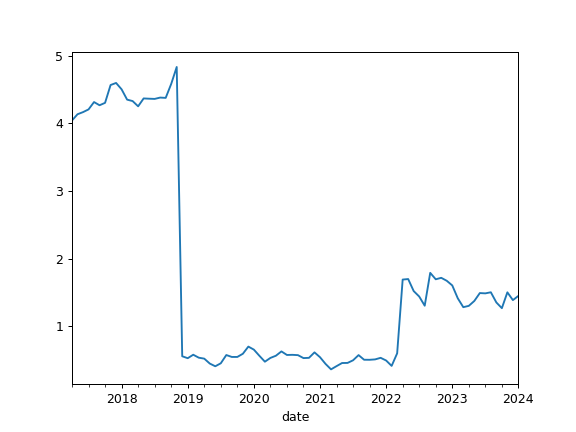
>>> pf = ok.Portfolio(['BND.US'])
>>> pf.kurtosis_rolling(window=12*10)
Date
2017-04    4.041599
2017-05    4.133518
2017-06    4.165099
2017-07    4.205125
2017-08    4.313773
...
2021-03    0.362184
2021-04    0.409680
2021-05    0.455760
2021-06    0.457315
2021-07    0.496168
Freq: M, Name: portfolio_4411.PF, dtype: float64
>>> import matplotlib.pyplot as plt
>>> pf.kurtosis_rolling(window=12*10).plot()
>>> plt.show()