annual_return_ts
- Portfolio.annual_return_ts(return_type='cagr')
Calculate annual rate of return time series for portfolio.
Rate of return is calculated for each calendar year.
- Parameters:
- return_type{‘cagr’, ‘arithmetic_mean’}, default ‘cagr’
Method used to calculate annual returns.
- Returns:
- Series
Calendar annual rate of return time series.
Examples
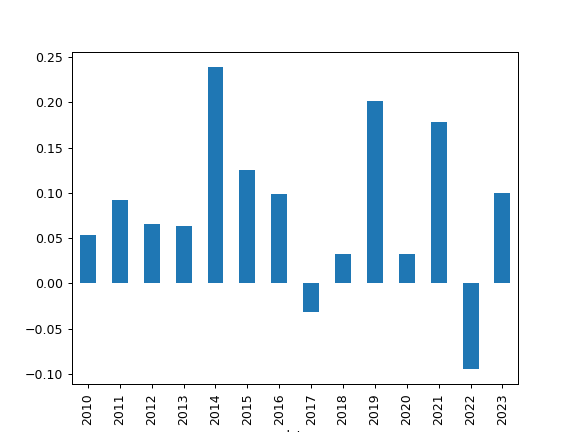
>>> import matplotlib.pyplot as plt
>>> pf = ok.Portfolio(["VOO.US", "AGG.US"], weights=[0.4, 0.6])
>>> pf.annual_return_ts().plot(kind="bar")
>>> plt.show()
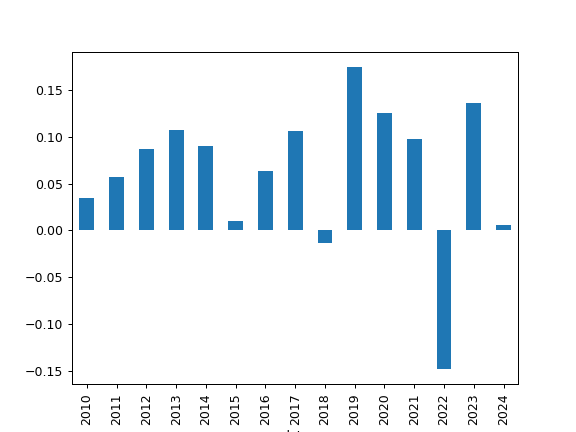
Plot annual returns for portfolio with EUR as the base currency.
>>> pf = ok.Portfolio(["VOO.US", "AGG.US"], weights=[0.4, 0.6], ccy="EUR")
>>> pf.annual_return_ts().plot(kind="bar")
>>> plt.show()