okama.Portfolio.plot_forecast_monte_carlo
- Portfolio.plot_forecast_monte_carlo(distr='norm', years=1, n=20, figsize=None)
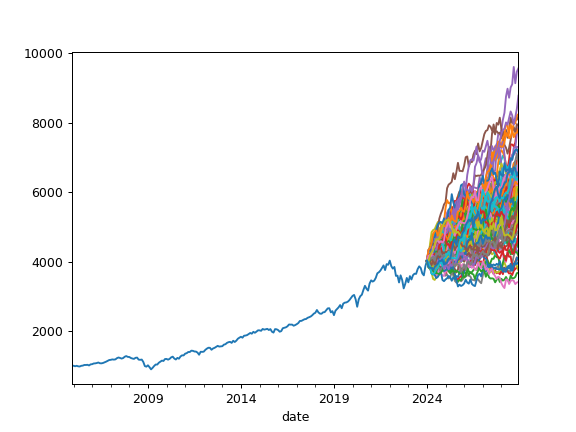
Plot Monte Carlo simulation for portfolio wealth indexes together with historical wealth index.
Random wealth indexes are generated according to a given distribution.
- Parameters:
- distr{‘norm’, ‘lognorm’}, default ‘norm’
Distribution type for the rate of return of portfolio. ‘norm’ - for normal distribution. ‘lognorm’ - for lognormal distribution.
- yearsint, default 1
Investment period length for new wealth indexes It should not exceed 1/2 of the portfolio history period length ‘period_length’.
- nint, default 20
Number of random wealth indexes to generate with Monte Carlo simulation.
- figsize(float, float), optional
Width, height in inches. If None default matplotlib figsize value is used.
Examples
>>> import matplotlib.pyplot as plt
>>> pf = ok.Portfolio(['SPY.US', 'AGG.US', 'GLD.US'],
...                    weights=[.60, .35, .05],
...                    rebalancing_period='year')
>>> pf.plot_forecast_monte_carlo(years=5, distr='lognorm', n=100)
>>> plt.show()