plot_cml
- EfficientFrontier.plot_cml(rf_return=0, figsize=None)
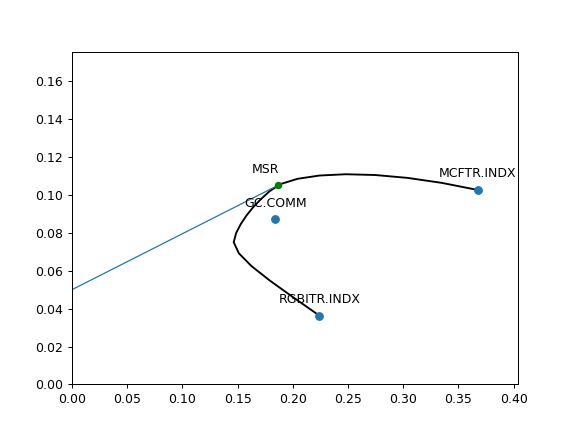
Plot Capital Market Line (CML).
The Capital Market Line (CML) is the tangent line drawn from the point of the risk-free asset (volatility is zero) to the point of tangency portfolio or Maximum Sharpe Ratio (MSR) point.
The slope of the CML is the Sharpe ratio of the tangency portfolio.
- Parameters:
- rf_returnfloat, default 0
Risk-free rate of return.
- figsizetuple[float, float], default None
Figure size (width, height) in inches. If None, matplotlib default is used.
- Returns:
- Axes
Matplotlib axes with the plot.
Examples
>>> import matplotlib.pyplot as plt
>>> three_assets = ["SPY.US", "AGG.US", "GLD.US"]
>>> ef = ok.EfficientFrontier(assets=three_assets, ccy="USD", full_frontier=True)
>>> ef.plot_cml(rf_return=0.05)  # Risk-Free return is 5%
>>> plt.show()