skewness_rolling
- AssetList.skewness_rolling(window=60)
Compute rolling skewness of the return time series for each asset.
Skewness is a measure of the asymmetry of the probability distribution of a real-valued random variable about its mean. The skewness value can be positive, zero, negative, or undefined.
For normally distributed returns, the skewness should be about zero. A skewness value greater than zero means that there is more weight in the right tail of the distribution.
- Parameters:
- windowint, default 60
Rolling window size in months. This is the number of observations used for calculating the statistic. The window size should be at least 12 months.
- Returns:
- DataFrame
Rolling skewness time series for each asset.
See also
skewnessCompute skewness.
kurtosisCalculate expanding Fisher (normalized) kurtosis.
kurtosis_rollingCalculate rolling Fisher (normalized) kurtosis.
jarque_beraPerform Jarque-Bera test for normality.
kstestPerform Kolmogorov-Smirnov test for different types of distributions.
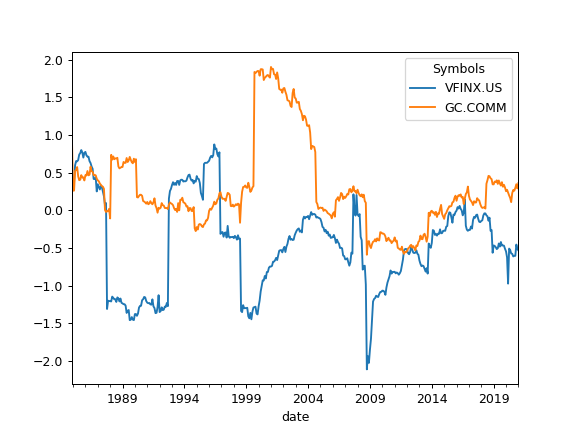
Examples
>>> import matplotlib.pyplot as plt
>>> al = ok.AssetList(["VFINX.US", "GC.COMM"], last_date="2021-01")
>>> al.names
{'VFINX.US': 'VANGUARD 500 INDEX FUND INVESTOR SHARES',
'GC.COMM': 'Gold'}
>>> al.skewness_rolling(window=12 * 5).plot()
>>> plt.show()