kurtosis_rolling
- AssetList.kurtosis_rolling(window=60)
Calculate rolling Fisher (normalized) kurtosis of the return time series for each asset.
Kurtosis is the fourth central moment divided by the square of the variance. It is a measure of the “tailedness” of the probability distribution of a real-valued random variable.
Kurtosis should be close to zero for normal distribution.
- Parameters:
- windowint, default 60
Rolling window size in months. This is the number of observations used for calculating the statistic. The window size should be at least 12 months.
- Returns:
- DataFrame
Rolling kurtosis time series for each asset.
See also
skewnessCompute skewness.
skewness_rollingCompute rolling skewness.
kurtosisCalculate expanding Fisher (normalized) kurtosis.
jarque_beraPerform Jarque-Bera test for normality.
kstestPerform Kolmogorov-Smirnov test for different types of distributions.
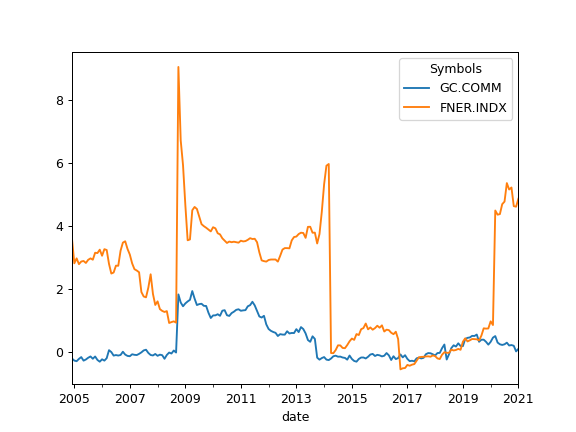
Examples
>>> import matplotlib.pyplot as plt
>>> al = ok.AssetList(["GC.COMM", "FNER.INDX"], first_date="2000-01", last_date="2021-01")
>>> al.names
{'GC.COMM': 'Gold',
'FNER.INDX': 'FTSE NAREIT All Equity REITs'}
>>> al.kurtosis_rolling(window=12 * 5).plot()
>>> plt.show()