IndexationStrategy
- class IndexationStrategy(parent, frequency='none', initial_investment=1000.0, time_series_dic={}, time_series_discounted_values=False, amount=0, indexation=None)
Bases:
CashFlowCash flow strategy with regular indexed withdrawals or contributions.
- Parameters:
- parentPortfolio
Parent Portfolio instance.
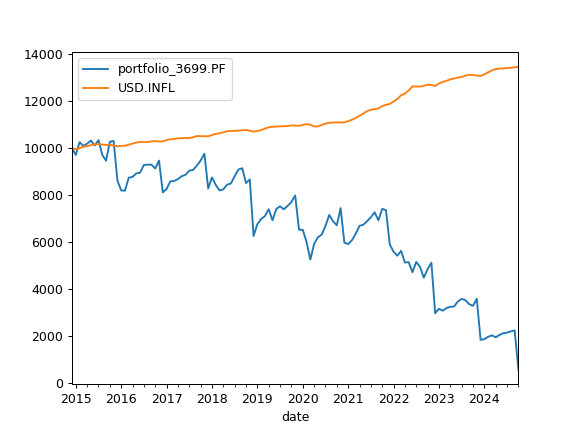
Examples
>>> import matplotlib.pyplot as plt
>>> pf = ok.Portfolio(first_date="2015-01", last_date="2024-10")  # create Portfolio with default parameters
>>> # Set the cash flow strategy
>>> ind = ok.IndexationStrategy(pf)  # create IndexationStrategy linked to the portfolio
>>> ind.initial_investment = 10_000  # add initial investments size
>>> ind.frequency = "year"  # set cash flow frequency
>>> ind.amount = -1_500  # set withdrawal size
>>> ind.indexation = "inflation"
>>> # Assign the strategy to Portfolio
>>> pf.dcf.cashflow_parameters = ind
>>> # Plot wealth index with cash flow
>>> pf.dcf.wealth_index(discounting="fv", include_negative_values=False).plot()
>>> plt.show()
Methods & Attributes
Portfolio regular withdrawal or contribution size.
The frequency of regular withdrawals or contributions in the strategy.
Portfolio cash flow indexation rate.
Initial investment (FV) amount at the start of the calculation period.
Get the number of periods per year based on the frequency.
Cash flow time series in form of dictionary.
- NAME = 'fixed_amount'
- property amount
Portfolio regular withdrawal or contribution size. Negative value corresponds to withdrawals. Positive value corresponds to contributions. Cash flow value is indexed each period by ‘indexation’.
The frequency of withdrawals or contributions is determined by the frequency parameter.
- Returns:
- float
Portfolio regular cash flow size.
- property indexation
Portfolio cash flow indexation rate.
- Returns:
- float
Cash flow indexation rate.
- property frequency
The frequency of regular withdrawals or contributions in the strategy.
Allowed values for frequency:
‘none’ no frequency (default value)
‘year’ annual cash flows
‘half-year’ 6 months cash flows
‘quarter’ 3 months cash flows
‘month’ 1 month cash flows
- Returns:
- str
The frequency of withdrawals or contributions.
- property initial_investment
Initial investment (FV) amount at the start of the calculation period.
For historical backtesting, this is the investment at first_date. For Monte Carlo simulations, this is the investment at last_date. Initial investment must be positive.
- Returns:
- float
Portfolio initial investment.
- property periods_per_year
Get the number of periods per year based on the frequency.
- Returns:
- int
Number of periods per year.
- property time_series_dic
Cash flow time series in form of dictionary.
Negative number corresponds to withdrawals, positive number corresponds to contributions.
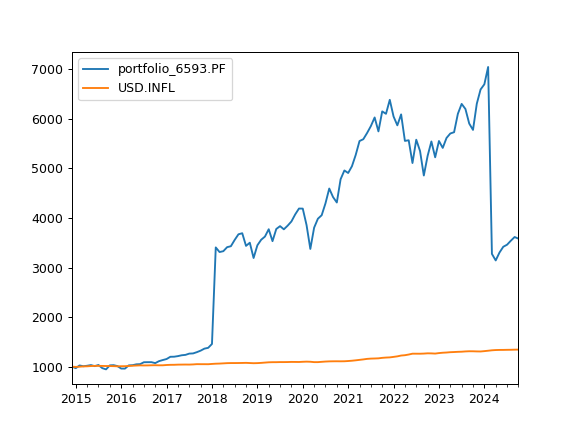
Examples
>>> import matplotlib.pyplot as plt
>>> pf = ok.Portfolio(first_date="2015-01", last_date="2024-10")  # create Portfolio with default parameters
>>> # create simple dictionary with cash flow amounts and dates
>>> d = {"2018-02": 2_000, "2024-03": -4_000}
>>> ts = ok.TimeSeriesStrategy(pf)  # create TimeSeresStrategy linked to the portfolio
>>> ts.time_series_dic = d  # use the dictionary to set cash flow
>>> ts.initial_investment = 1_000  # add initial investments size (optional)
>>> # Assign the strategy to Portfolio
>>> pf.dcf.cashflow_parameters = ts
>>> # Plot wealth index with cash flow
>>> pf.dcf.wealth_index(discounting="fv", include_negative_values=False).plot()
>>> plt.show()