VanguardDynamicSpending
- class VanguardDynamicSpending(parent, initial_investment=1000.0, time_series_dic={}, time_series_discounted_values=False, percentage=0.0, min_max_annual_withdrawals=None, adjust_min_max=True, floor_ceiling=None, adjust_floor_ceiling=False, indexation=None)
Bases:
PercentageStrategyVanguard Dynamic Spending strategy.
The withdrawal amount is calculated as a percentage of the portfolio balance.
The floor_ceiling parameter limits the withdrawals relative to the previous year’s cash flow.
The absolute withdrawal amount can be optionally limited with min_max_annual_withdrawal. If adjust_min_max=True, these bounds are indexed using indexation.
- Parameters:
- parentPortfolio
The parent Portfolio instance.
- initial_investmentfloat, optional
Initial investment amount. Default is 1000.0.
- time_series_dicdict, optional
Dictionary with dates and cash flow values. Default is empty dict.
- time_series_discounted_valuesbool, optional
If True, values in time_series_dic are considered as discounted (PV). Default is False.
- percentagefloat, optional
Percentage of portfolio balance to be withdrawn. Negative value. Default is 0.0.
- min_max_annual_withdrawalstuple[float, float], optional
Optional absolute min/max annual withdrawal amounts (positive values). Default is None.
- adjust_min_maxbool, optional
If True, min/max bounds are indexed using indexation. Default is True.
- floor_ceilingtuple[float, float], optional
Year-to-year withdrawal change limits relative to the previous year’s withdrawal. Example: (-0.025, 0.05) means the next withdrawal cannot be more than 2.5% lower or 5% higher than the previous year’s withdrawal. Default is None.
- adjust_floor_ceilingbool, optional
If True, the previous year’s withdrawal amount is indexed before applying floor/ceiling limits. Default is False.
- indexationstr or float, optional
Indexation rate. Default is None.
Examples
>>> import matplotlib.pyplot as plt
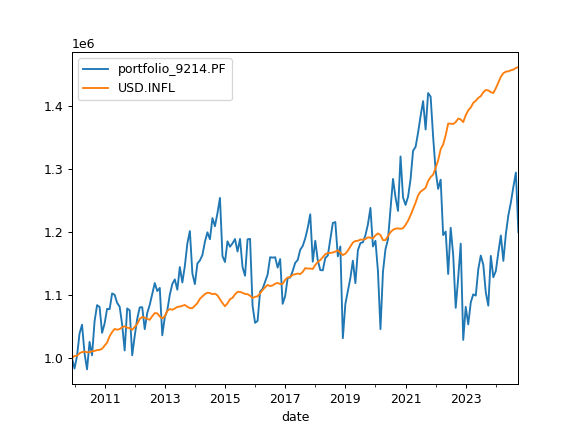
>>> pf = ok.Portfolio(
...     ["SPY.US", "BND.US"], weights=[0.6, 0.4], first_date="2010-01", last_date="2024-10", ccy="USD", inflation=True
... )
>>> vds = ok.VanguardDynamicSpending(
...     parent=pf,
...     initial_investment=1_000_000,
...     percentage=-0.08,
...     floor_ceiling=(-0.025, 0.05),
...     min_max_annual_withdrawals=(40_000, 100_000),
...     adjust_min_max=True,
...     indexation="inflation",
... )
>>> pf.dcf.cashflow_parameters = vds
>>> pf.dcf.wealth_index(discounting="fv", include_negative_values=False).plot()
>>> plt.show()
Methods & Attributes
Whether to adjust floor and ceiling by indexation.
Whether to adjust min and max limits by indexation.
Floor and ceiling percentages relative to the previous year's withdrawal.
Frequency of cash flows.
Indexation rate for Minimum/Maximum annual withdrawal and Floor/Ceiling.
Initial investment (FV) amount at the start of the calculation period.
Minimum and maximum annual withdrawal limits.
The percentage of withdrawals (no contributions are allowed in VDS strategy).
Get the number of periods per year based on the frequency.
Cash flow time series in form of dictionary.
- NAME = 'VDS'
- property percentage
The percentage of withdrawals (no contributions are allowed in VDS strategy). The value must be negative.
The size of withdrawals is defined as a percentage of portfolio balance per year.
- Returns:
- float
The percentage of withdrawals or contributions.
- property frequency
Frequency of cash flows. Always ‘year’ for VDS.
- property min_max_annual_withdrawals
Minimum and maximum annual withdrawal limits.
- property initial_investment
Initial investment (FV) amount at the start of the calculation period.
For historical backtesting, this is the investment at first_date. For Monte Carlo simulations, this is the investment at last_date. Initial investment must be positive.
- Returns:
- float
Portfolio initial investment.
- property periods_per_year
Get the number of periods per year based on the frequency.
- Returns:
- int
Number of periods per year.
- property time_series_dic
Cash flow time series in form of dictionary.
Negative number corresponds to withdrawals, positive number corresponds to contributions.
Examples
>>> import matplotlib.pyplot as plt
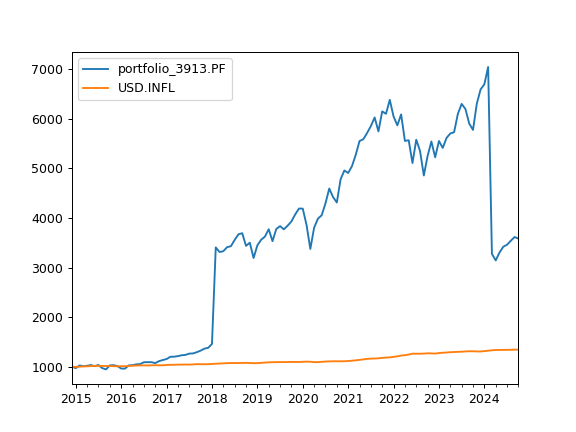
>>> pf = ok.Portfolio(first_date="2015-01", last_date="2024-10")  # create Portfolio with default parameters
>>> # create simple dictionary with cash flow amounts and dates
>>> d = {"2018-02": 2_000, "2024-03": -4_000}
>>> ts = ok.TimeSeriesStrategy(pf)  # create TimeSeresStrategy linked to the portfolio
>>> ts.time_series_dic = d  # use the dictionary to set cash flow
>>> ts.initial_investment = 1_000  # add initial investments size (optional)
>>> # Assign the strategy to Portfolio
>>> pf.dcf.cashflow_parameters = ts
>>> # Plot wealth index with cash flow
>>> pf.dcf.wealth_index(discounting="fv", include_negative_values=False).plot()
>>> plt.show()
- property adjust_min_max
Whether to adjust min and max limits by indexation.
- property floor_ceiling
Floor and ceiling percentages relative to the previous year’s withdrawal.
- property adjust_floor_ceiling
Whether to adjust floor and ceiling by indexation.
- property indexation
Indexation rate for Minimum/Maximum annual withdrawal and Floor/Ceiling.
- Returns:
- float
Indexation rate.