CutWithdrawalsIfDrawdown
- class CutWithdrawalsIfDrawdown(parent, frequency='year', initial_investment=1000.0, time_series_dic={}, time_series_discounted_values=False, amount=0.0, indexation=None, crash_threshold_reduction=[(0.2, 0.4), (0.5, 1)])
Bases:
IndexationStrategyWithdrawal strategy that reduces the withdrawal amount if the portfolio drawdown exceeds a certain threshold.
The reduction coefficients are defined in crash_threshold_reduction list of tuples.
- Parameters:
- parentPortfolio
The parent Portfolio instance.
- frequencystr, optional
Frequency of cash flows. Default is “year”.
- initial_investmentfloat, optional
Initial investment amount. Default is 1000.0.
- time_series_dicdict, optional
Dictionary with dates and cash flow values. Default is empty dict.
- time_series_discounted_valuesbool, optional
If True, values in time_series_dic are considered as discounted (PV). Default is False.
- amountfloat, optional
Regular withdrawal amount (negative value) before reduction. Default is 0.0. The frequency of withdrawals is determined by the frequency parameter.
- indexationstr or float, optional
Indexation rate for the withdrawal amount. Default is None.
- crash_threshold_reductionlist[tuple[float, float]], optional
List of tuples (threshold, reduction_coefficient). Example: [(0.20, 0.40)] means if drawdown > 20%, reduce withdrawal by 40%. Default is [(.20, .40), (.50, 1)].
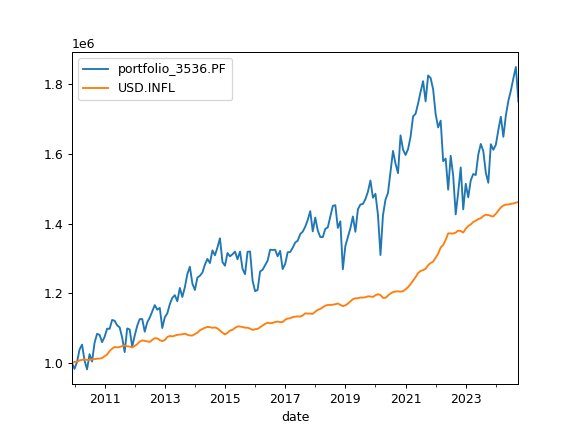
Examples
>>> import matplotlib.pyplot as plt
>>> pf = ok.Portfolio(
...     ["SPY.US", "BND.US"],
...     weights=[0.6, 0.4],
...     first_date="2010-01",
...     last_date="2024-10",
...     ccy="USD",
...     inflation=True,
... )
>>> cwid = ok.CutWithdrawalsIfDrawdown(
...     parent=pf,
...     initial_investment=1_000_000,
...     frequency="year",
...     amount=-60_000,
...     indexation="inflation",
...     crash_threshold_reduction=[(0.10, 0.25), (0.20, 0.50), (0.35, 1)],
... )
>>> pf.dcf.cashflow_parameters = cwid
>>> pf.dcf.wealth_index(discounting="fv", include_negative_values=False).plot()
>>> plt.show()
Methods & Attributes
Portfolio regular withdrawals size.
List of tuples (threshold, reduction_coefficient) that define how much withdrawals are reduced based on the portfolio drawdown depth.
The frequency of regular withdrawals or contributions in the strategy.
Portfolio cash flow indexation rate.
Initial investment (FV) amount at the start of the calculation period.
Convert list of tuples to pandas Series.
Get the number of periods per year based on the frequency.
Cash flow time series in form of dictionary.
- property frequency
The frequency of regular withdrawals or contributions in the strategy.
Allowed values for frequency:
‘none’ no frequency (default value)
‘year’ annual cash flows
‘half-year’ 6 months cash flows
‘quarter’ 3 months cash flows
‘month’ 1 month cash flows
- Returns:
- str
The frequency of withdrawals or contributions.
- property indexation
Portfolio cash flow indexation rate.
- Returns:
- float
Cash flow indexation rate.
- property initial_investment
Initial investment (FV) amount at the start of the calculation period.
For historical backtesting, this is the investment at first_date. For Monte Carlo simulations, this is the investment at last_date. Initial investment must be positive.
- Returns:
- float
Portfolio initial investment.
- property periods_per_year
Get the number of periods per year based on the frequency.
- Returns:
- int
Number of periods per year.
- property time_series_dic
Cash flow time series in form of dictionary.
Negative number corresponds to withdrawals, positive number corresponds to contributions.
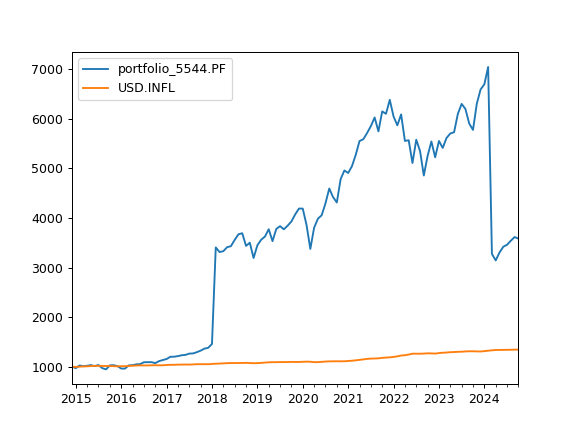
Examples
>>> import matplotlib.pyplot as plt
>>> pf = ok.Portfolio(first_date="2015-01", last_date="2024-10")  # create Portfolio with default parameters
>>> # create simple dictionary with cash flow amounts and dates
>>> d = {"2018-02": 2_000, "2024-03": -4_000}
>>> ts = ok.TimeSeriesStrategy(pf)  # create TimeSeresStrategy linked to the portfolio
>>> ts.time_series_dic = d  # use the dictionary to set cash flow
>>> ts.initial_investment = 1_000  # add initial investments size (optional)
>>> # Assign the strategy to Portfolio
>>> pf.dcf.cashflow_parameters = ts
>>> # Plot wealth index with cash flow
>>> pf.dcf.wealth_index(discounting="fv", include_negative_values=False).plot()
>>> plt.show()
- NAME = 'CWD'
- property amount
Portfolio regular withdrawals size. Must be negative. Cash flow value is indexed each period by ‘indexation’.
The frequency of withdrawals or contributions is determined by the frequency parameter.
- Returns:
- float
Portfolio regular cash flow size.
- property crash_threshold_reduction
List of tuples (threshold, reduction_coefficient) that define how much withdrawals are reduced based on the portfolio drawdown depth.
- make_series_from_list(l)
Convert list of tuples to pandas Series.
- Parameters:
- llist[tuple[float, float]]
List of tuples.
- Returns:
- pd.Series
Series with threshold as index and reduction as value.