dividends_annual
- property AssetList.dividends_annual
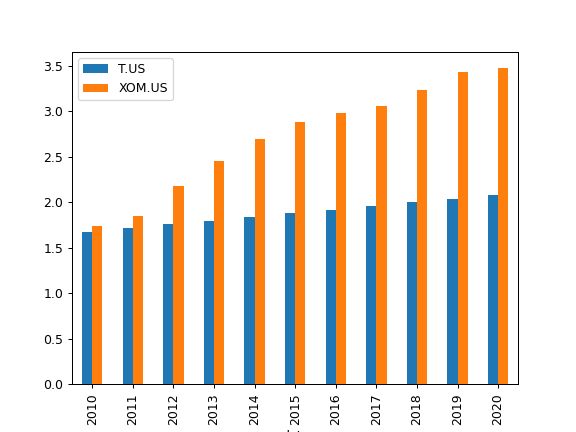
Return calendar year dividends sum time series for each asset.
- Returns:
- DataFrame
Annual dividends time series for each asset.
See also
dividend_yieldDividend yield time series.
dividend_yield_annualCalendar year dividend yield time series.
dividend_paying_yearsNumber of years of consecutive dividend payments.
dividend_growing_yearsNumber of years when the annual dividend was growing.
get_dividend_mean_yieldArithmetic mean for annual dividend yield.
get_dividend_mean_growth_rateGeometric mean of annual dividends growth rate.
Examples
>>> import matplotlib.pyplot as plt
>>> x = ok.AssetList(["T.US", "XOM.US"], first_date="2010-01", last_date="2020-12")
>>> x.dividends_annual.plot(kind="bar")
>>> plt.show()