wealth_index
- PortfolioDCF.wealth_index(discounting, include_negative_values=False)
Calculate wealth index time series for the portfolio with cash flow (contributions and withdrawals) using historical rate of returns.
Wealth index (Cumulative Wealth Index) is a time series that presents the value of portfolio over historical time period considering cash flows.
Accumulated inflation time series is added if inflation=True in the Portfolio.
If there is no cash flow, Wealth index is obtained from the accumulated return multiplied by the initial investments. That is: initial_investment * (Accumulated_Return + 1)
- Parameters:
- discounting{‘fv’, ‘pv’}
Type of discounting to apply: - ‘fv’: Future Values - nominal values without discounting - ‘pv’: Present Values - values discounted to present using the discount rate
- include_negative_valuesbool, default False
Whether to include negative wealth index values in the result. If False, negative values are replaced with zeros.
- Returns:
- pd.DataFrame
Time series of wealth index values for portfolio and accumulated inflation (if applicable).
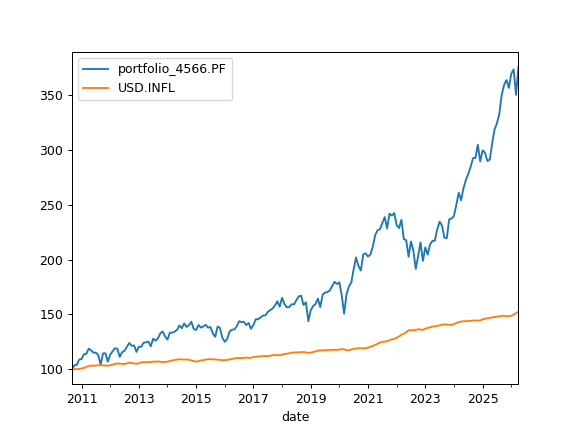
Examples
>>> import matplotlib.pyplot as plt
>>> pf = ok.Portfolio(["VOO.US", "GLD.US"], weights=[0.8, 0.2])
>>> ind = ok.IndexationStrategy(pf)  # Set Cash Flow Strategy parameters
>>> ind.initial_investment = 100  # initial investments value
>>> ind.frequency = "year"  # withdrawals frequency
>>> ind.amount = -6  # initial withdrawals amount
>>> ind.indexation = "inflation"  # the indexation is equal to inflation
>>> pf.dcf.cashflow_parameters = ind  # assign the strategy to Portfolio
>>> pf.dcf.wealth_index(discounting="fv", include_negative_values=False).plot()
>>> plt.show()