plot_forecast_monte_carlo
- PortfolioDCF.plot_forecast_monte_carlo(backtest=True, figsize=None)
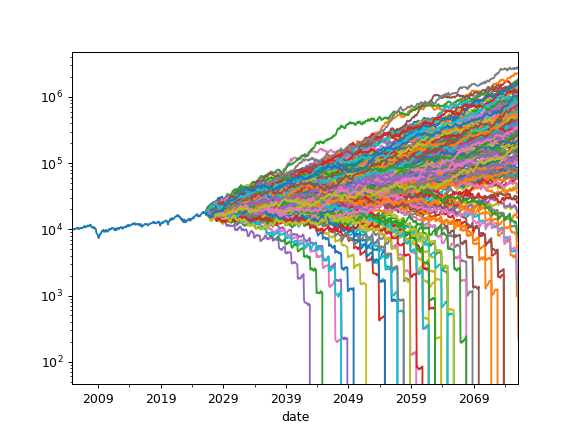
Plot Monte Carlo simulation for portfolio future wealth indexes optionally together with historical wealth index.
Wealth index (Cumulative Wealth Index) is a time series that presents the value of portfolio over time period considering cash flows (portfolio withdrawals/contributions).
Random wealth indexes are generated according to a given distribution.
- Parameters:
- backtestbool, default True
Include historical wealth index if True.
- figsizetuple of (float, float), default None
Figure size (width, height) in inches. If None, matplotlib defaults are used.
- Returns:
- Axes
Matplotlib axes object.
Examples
>>> import matplotlib.pyplot as plt
>>> pf = ok.Portfolio(
...     assets=["SPY.US", "AGG.US", "GLD.US"],
...     weights=[0.60, 0.35, 0.05],
...     rebalancing_strategy=ok.Rebalance(period="year"),
... )
>>> # Set Monte Carlo parameters
>>> pf.dcf.set_mc_parameters(distribution="norm", period=50, mc_number=200)
>>> # set cash flow parameters
>>> ind = ok.IndexationStrategy(pf)  # create cash flow strategy linked to the portfolio
>>> ind.initial_investment = 10_000  # add initial investment to cash flow strategy
>>> ind.amount = -500  # set withdrawal size
>>> ind.frequency = "year"  # set withdrawal frequency
>>> pf.dcf.cashflow_parameters = ind  # assign cash flow strategy to portfolio
>>> pf.dcf.plot_forecast_monte_carlo(backtest=True)
>>> plt.yscale("log")  # Y-axis has logarithmic scale
>>> plt.show()