monte_carlo_cash_flow
- PortfolioDCF.monte_carlo_cash_flow(discounting, remove_if_wealth_index_negative=True)
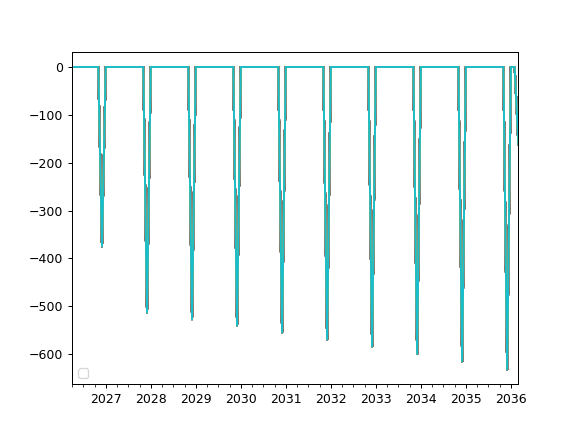
Calculate portfolio random cash flow (withdrawals/contributions) time series by Monte Carlo simulation.
Monte Carlo simulation generates n random monthly time series of cash flows. Each cash flow time series corresponds to a wealth index calculated with rate of return time series of a given distribution.
First date of forecasted returns is portfolio last_date.
- Parameters:
- discounting{‘fv’, ‘pv’}
Type of discounting to apply: - ‘fv’: Future Values - nominal values without discounting - ‘pv’: Present Values - values discounted to present using the discount rate
- remove_if_wealth_index_negativebool, default True
If True, cash flow values are replaced with 0 when wealth index is negative (or zero).
- Returns:
- DataFrame
Table with n random cash flow monthly time series.
Examples
>>> import matplotlib.pyplot as plt
>>> pf = ok.Portfolio(
...     ["SPY.US", "AGG.US", "GLD.US"],
...     weights=[0.60, 0.35, 0.05],
...     rebalancing_strategy=ok.Rebalance(period="month"),
... )
>>> pf.dcf.set_mc_parameters(distribution="t", period=10, mc_number=100)  # Set Monte Carlo parameters
>>> # set cash flow parameters
>>> ind = ok.IndexationStrategy(pf)  # create cash flow strategy linked to the portfolio
>>> ind.initial_investment = 10_000  # add initial investment to cash flow strategy
>>> ind.amount = -500  # set withdrawal size
>>> ind.frequency = "year"  # set withdrawal frequency
>>> pf.dcf.cashflow_parameters = ind  # assign cash flow strategy to portfolio
>>> pf.dcf.monte_carlo_cash_flow(discounting="fv").plot()
>>> plt.legend("")  # don't show legend for each line
>>> plt.show()