plot_hist_fit
- MonteCarlo.plot_hist_fit(bins=None)
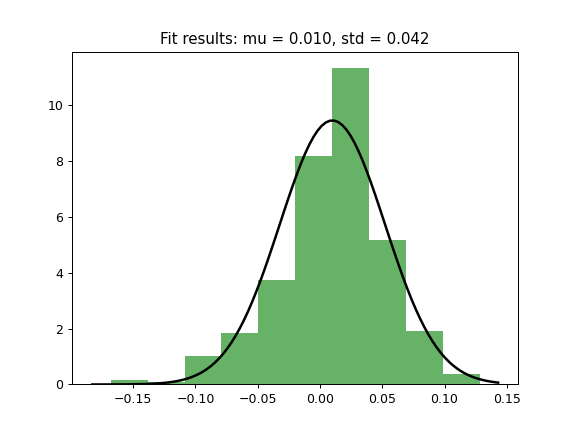
Plot a histogram of historical monthly returns and overlay the fitted theoretical PDF.
Uses the currently selected distribution (self.distribution) and its resolved parameters to draw the probability density function.
- Parameters:
- binsint, default None
Number of histogram bins. If None, matplotlib will choose automatically.
- Returns:
- Axes
Matplotlib axes object.
Examples
>>> import matplotlib.pyplot as plt
>>> pf = ok.Portfolio(["SP500TR.INDX"])
>>> pf.dcf.set_mc_parameters(distribution="norm")
>>> pf.dcf.mc.plot_hist_fit()
>>> plt.show()