tracking_error
- Portfolio.tracking_error(benchmark, rolling_window=None, method='rms')
Calculate ex-post tracking error time series of the portfolio against a benchmark.
Tracking error is an ex-post (backward-looking) measure of how closely the portfolio follows the benchmark. It is computed from the realized monthly return differences between the portfolio and the benchmark, and is annualized (multiplied by sqrt(12)). Tracking error values are decimal fractions: 0.05 corresponds to 5% annualized.
Two formulas are available (method parameter):
“rms” (default): root-mean-square of the return differences. The differences are not centered around their mean, hence the systematic lag between the portfolio and the benchmark (tracking difference) is included in the result.
“std”: sample standard deviation of the return differences with Bessel’s correction — the classic tracking error definition (Hwang & Satchell, “Tracking Error: Ex-Ante versus Ex-Post Measures”, 2001, eq. 2) measuring the pure volatility of deviations from the benchmark. The first point of the expanding time series is dropped (a single observation has no standard deviation).
The benchmark rate of return is converted to the portfolio base currency, and the time period is limited to the intersection of the portfolio and benchmark available histories.
- Parameters:
- benchmarkstr, Asset, Portfolio
Benchmark ticker (e.g. “SP500TR.INDX”) or an asset-like object (Asset, Portfolio).
- rolling_windowint or None, default None
Size of the moving window in months. Must be at least 12 months. If None calculate expanding tracking error.
- method{“rms”, “std”}, default “rms”
Tracking error formula: “rms” for the uncentered root-mean-square of return differences, “std” for the centered sample standard deviation.
- Returns:
- Series
Expanding or rolling annualized tracking error time series. The series is named after the portfolio symbol.
Examples
>>> import matplotlib.pyplot as plt
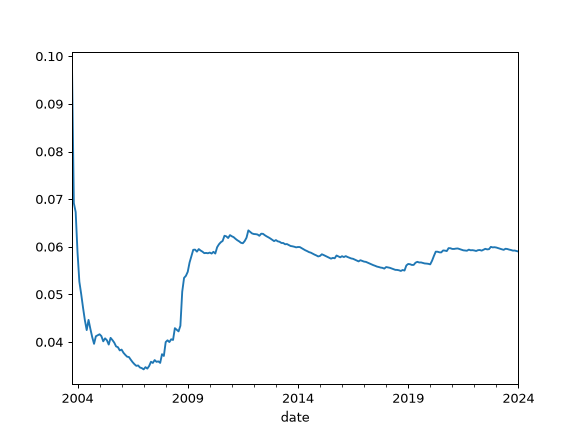
>>> pf = ok.Portfolio(["SPY.US", "AGG.US"], weights=[0.60, 0.40], last_date="2024-01")
>>> pf.tracking_error(benchmark="SP500TR.INDX").plot()
>>> plt.show()
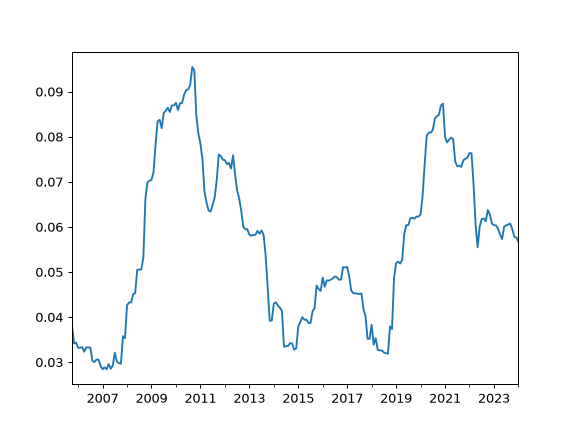
To calculate rolling tracking error set rolling_window to a number of months (moving window size):
>>> pf.tracking_error(benchmark="SP500TR.INDX", rolling_window=24, method="std").plot()
>>> plt.show()