price_drawdowns
- property Portfolio.price_drawdowns
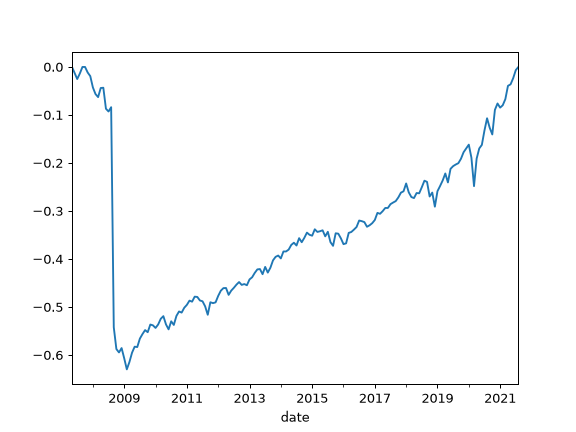
Calculate price drawdowns time series for the portfolio.
The price drawdown is the percent decline from a previous peak in the portfolio price index. The price index is built from the assets close prices (not adjusted for dividends) with the same weights and rebalancing strategy as the portfolio, hence price drawdowns may significantly differ from drawdowns (based on total return) for portfolios with high dividend assets.
The price index is anchored at the first month of the period, so price drawdowns cover the same months as drawdowns.
- Returns:
- Series
Price drawdowns time series for the portfolio.
See also
drawdownsCalculate drawdowns from total return (with dividends reinvested).
Examples
>>> import matplotlib.pyplot as plt
>>> pf = ok.Portfolio(["SPY.US", "BND.US"], ccy="USD", last_date="2021-08")
>>> pf.price_drawdowns.plot()
>>> plt.show()