assets_close_monthly
- property Portfolio.assets_close_monthly
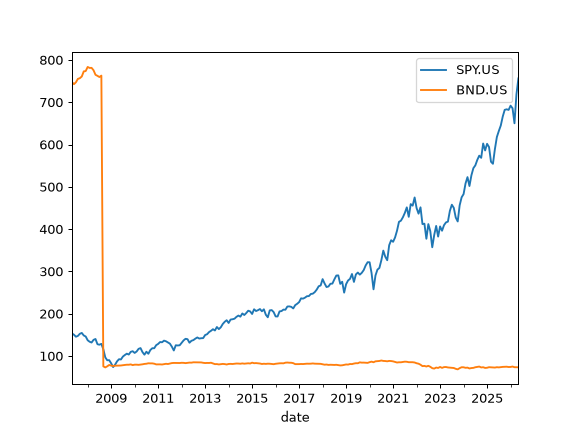
Show assets monthly close time series adjusted to the base currency.
- Returns:
- DataFrame
Assets monthly close time series adjusted to the base currency.
Examples
>>> import matplotlib.pyplot as plt
>>> al = ok.AssetList(["SPY.US", "BND.US"], ccy="USD")
>>> al.assets_close_monthly.plot()
>>> plt.show()