price_drawdowns
- property AssetList.price_drawdowns
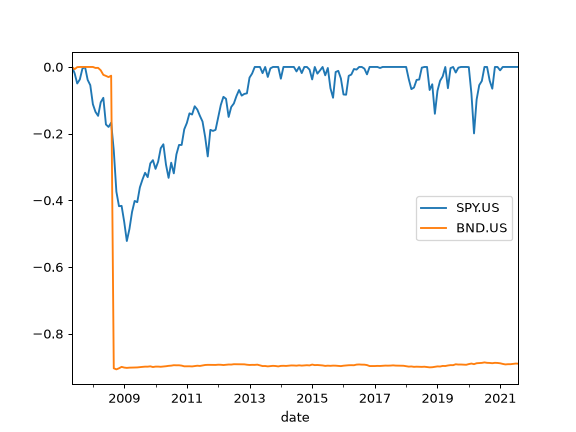
Calculate price drawdowns time series for the assets.
The price drawdown is the percent decline from a previous peak in close price. Close prices are not adjusted for corporate actions (dividends and splits), hence price drawdowns may significantly differ from drawdowns (based on total return) for assets with high dividends.
- Returns:
- DataFrame
Time series of price drawdowns.
See also
drawdownsCalculate drawdowns from total return (with dividends reinvested).
Examples
>>> import matplotlib.pyplot as plt
>>> al = ok.AssetList(["SPY.US", "BND.US"], last_date="2021-08")
>>> al.price_drawdowns.plot()
>>> plt.show()